never settle android app

So I have to come back to work on the robot measuring project…in which I had to switched to the floorplan project last week…

These days, I somehow annoyed about the 5G signal measuring phone…so that I cannot move on the robot part. and the meeting deadline is upcoming….

Now I have 5 version of the apps (powered by Claude).

  • v1: the one that company developed, and I added the cellID
  • v2: the one where I found that the GPS was not accurate in real time, so I fixed it. I also appended more information by mimicking the GNetTrack app (PCI, TAC, eNB, MCC, MNC, EARFCN, band, bandwidth, timing advance, level; GPS altitude/accuracy/speed/bearing). There is also a neighborCells report. I just found out that there are also neighbor cells signal…..
  • v3: somehow change the code/format/layout tried to split 5G NR out from the 4G LTE.
  • I found out how the company gets the signal data, and I don’t really like the approach. They aggregate data from three sources: 1) servingSignal callback, 2) cached TelephonyManager.signalStrength, and 3) CellInfo.cellSignalStrength, and then take whichever one is the most recent. But when I look at each source individually, they don’t show a similar trend at all. They are different metrics! Why don’t they check and understand the data first before merging them into the same group? I’m quite upset after finding this out.
  • But later try to find the best way to get the accurate signal value…I found that there are 5 ways (or more) to get the signal data (push or poll) on different android API version….the name are similar, and it make me hard to make a decision…so I leave it to the Claude…. (this recall me on my past android app dev, just the newer API, the worked calendar function doesn’t work anymore….)
  • v4: still working on how to get the 5G NR data, also add the carrier aggregate info, and base station estimation map so that I would know which direction I should walk to accurately locate the BS position.
  • v5: make the data update 1 Hz as possible. remove the base station map as get more data and calculate offline is better. also the CA never shown (while reported in GNetTrack or NetworkSignalGURU), also add batteryPercent to track in case that I leave the smartphone several days.

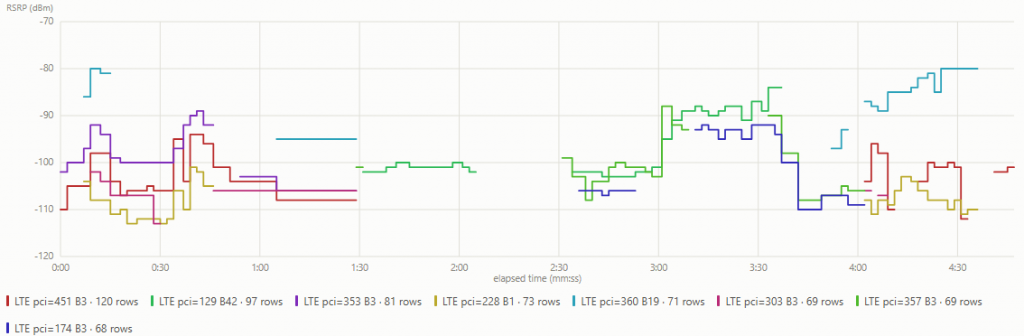
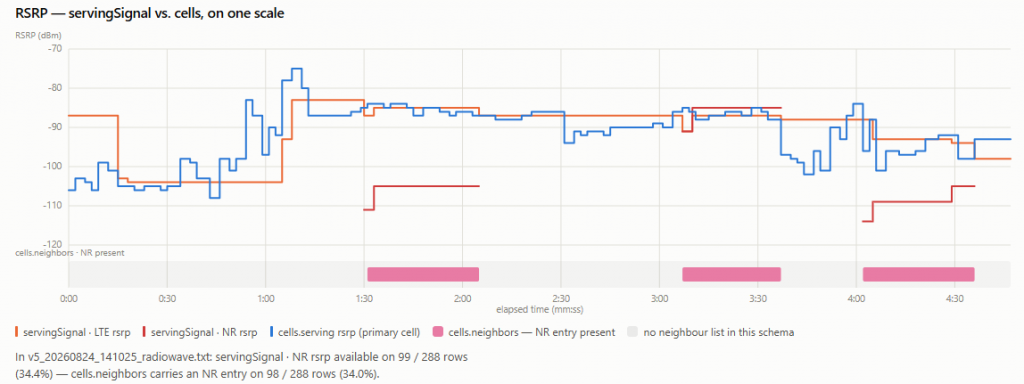
So, I gonna conclude that the data from serving? SignalStrenght (the orange) is less update,the one from CellInfo (blue) changes a lot (though flucturate…), and the NR data (red) is rare…just 30%

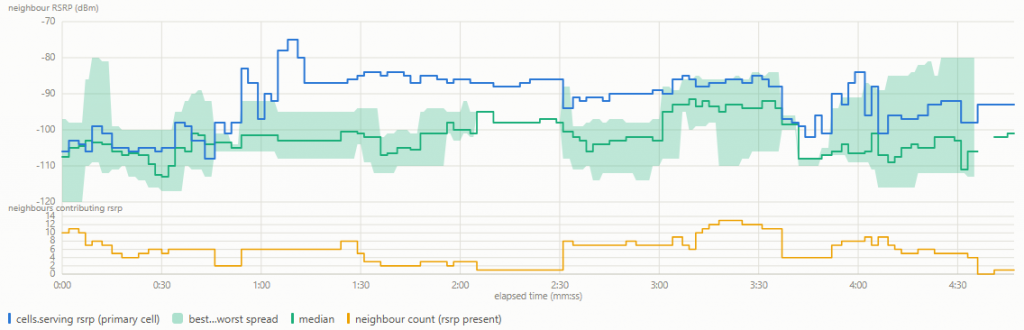
Then, look in to the Cell info neighbor cells (green) compare to the primary cell (blue), yeeah… the primary cell signal is stronger than the average neighbor cell…

Here is a plot of all neighbor cell, so fluctuate….

workaholic

I can’t remember my WordPress pw, not sure when did I change the pw… btw, I often can’t remember anything recently, maybe due to my brain being overloaded. After I got locked out due to the login timeout, I reset my pw to the usual one… although it’s a weak pw…

Then, many things I wanna say… regarding work…
as I want to settle what I’m thinking, what I’ve done.

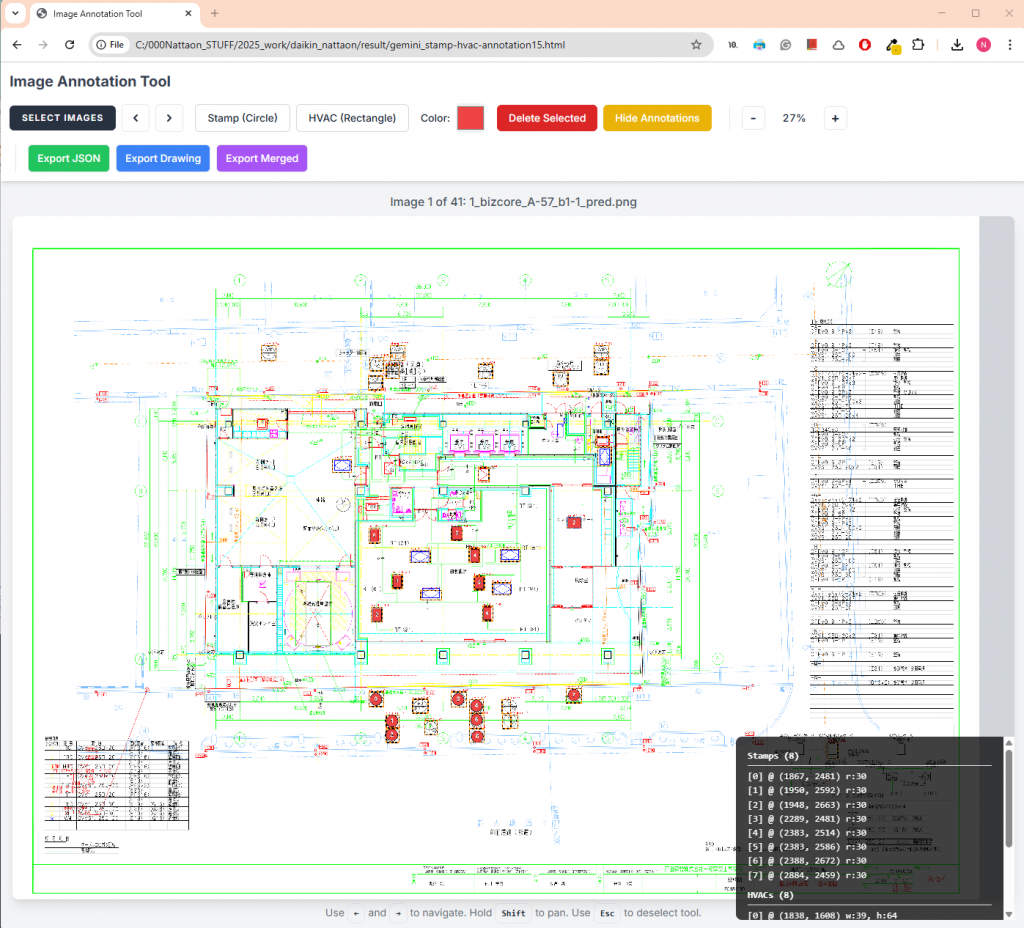
Part of my work; the radio signal measurement robot system with digital twin connection (as a database? realtime viz, offline viz, anything…)

With the coming of AI, Claude helps me a lot with programming/data debugging/visualizing. But I also need time to review the results and make decisions, which somehow exhausts me… due to too much information….

1. signal measuring smartphone app:
which was originally developed by a company, but later modified many times. let me complain about them… there is a first month for customer requirement gathering; during that time, I had decided everything in the order document (as my boss told me to do), then I just asked them whether there was anything else I could measure other than RSRP, RSRQ, SNR stuffs (as I just got a comment from the collaborative research company), then the guy just said, “I don’t know, it needs to be researched.” But since I didn’t ask them to find that information, they didn’t do it… yeah, I didn’t ask them to do that. but I paid you the money. well they did not get more salary, btw, they get one more job to do for the foreigner like me.

more things to say…. but I should not write them, better to forget… I don’t know why I’m often unhappy when I order a company to develop a system. maybe because I can do it… cheaper than them… also, I often have ideas to improve the system that come along seeing the progress, after placing the order requirement…

So, for the app, I added the Cell ID later (with AI power),
then I found out that the GPS is not accurate, the position is jumping, and with AI power, I found that there are many ways to get GPS info. The one that the company used updates every 6 seconds… but I required 1 second. Since I didn’t add a requirement to check the accuracy of the GPS, so they didn’t check the value? The reason is there is a battery saver function, so the GPS doesn’t update in realtime. Then I asked AI to fix the GPS to realtime.

Also, I need to get the band number. I later found the G-NetTrack app (which I had touched before, but if I had thought of it before placing the order, I would have let the company dev this part). There are many signal-related metrics which I don’t know much about, as I’m not in the field. I asked Claude to mimic the G-NetTrack app, and got a new version of the measuring app that measure a lot.

Then I want to get both 4G and 5G signals together with the base station and band information… but it seems there are 4 ways to call the Android API, each giving different metrics with different callback timers….. and I have a problem merging the data right now…

2. robot:
the ROS1 version works fine… with some collisions indoors. So I need to set many waypoints rather have a rough number. It is difficult to balance between letting the robot move through a narrow path between tables and not making a collision when rotating… there are 20+ parameters to adjust…

another company I contacted to solve this problem, I saw him adjusting the parameters for hours, but there were still some navigation failures.

I upgraded the robot to ROS2 with the hope that the navigation would be more clever… through the upgrade… with full Claude power… as I have no ROS2 knowledge… a lot of things to make a decision about… so exhausting…. and not done yet…

3. robot path planning:
just making it able to run with the robot in simulation is so difficult. a program that a PhD candidate student developed in Python, with a simple map with obstacle coordinates… I had to turn it into an application in ROS… I regret not asking the company to do this part, as at that time I didn’t know how to ask them to do it. and I knew that the algorithm was not settled yet, so I decided to do it on my own.

Not really, I wrote a requirement in the first draft of the order, but the quoted price was too high, so I cut this part out along with other parts in the second draft of the order, but still got the same price even after cutting out the functionality….

By the way, I made it work in ROS1 simulation, now I need to make it run in realtime in ROS2…. so overwhelmed.

4. the digital twin platform:
something that I have to invent as a novel work… which is just a realtime database with MongoDB… which is not really essential…. but costs 3.5 million yen… and I didn’t want to waste the money…. so I need to somehow make it more usable….
wanna eat

why I feel want to eat something while I read a difficult article

ChatGPT said:

That’s actually a pretty common brain–body response, and it comes down to how your mind handles effort and stress.

When you read something difficult, your brain shifts into high cognitive load mode — working memory, attention, and problem-solving all spike in activity. This can trigger a few things:

  1. Energy demand signal – Your brain runs almost entirely on glucose, and although reading doesn’t burn a huge amount of calories, sustained mental effort feels like an energy drain. Your body interprets that as a cue to refuel, making snacks suddenly sound appealing.
  2. Stress coping – Challenging reading can activate a mild stress response. Many people unconsciously use eating (especially sweet or crunchy snacks) as a comfort or grounding mechanism.
  3. Reward-seeking loop – Struggling with a hard text can feel frustrating. Eating activates your brain’s dopamine reward system, which can momentarily offset that discomfort — so your brain learns: “This is tough… snack time!”
  4. Habit association – If you’ve often eaten while studying or reading in the past, the mental strain might automatically trigger that old habit, even if you’re not physically hungry.

If you want to test whether it’s actual hunger or just a mental coping cue, you can try pausing for a moment and drinking water, stretching, or doing a 2-minute unrelated task before reaching for food — if the craving fades, it was likely brain-stress, not fuel need.

Here’s a compact 2-minute “in-flow craving reset” you can do without leaving your seat:


Minute 0–0:30 — Hydrate & Acknowledge

  • Take a few slow sips of water or tea.
  • Mentally note: “I’m not truly hungry; this is just a brain craving.”

Minute 0:30–1:30 — Micro-movement & sensory shift

  • Roll shoulders, stretch neck, wiggle fingers.
  • Adjust lighting or glance outside for a quick visual reset.

Minute 1:30–2:00 — Mini reward

  • Chew sugar-free gum or take two deep breaths.
  • Give your brain a tiny “reward” without food.

Kringing Algorithm

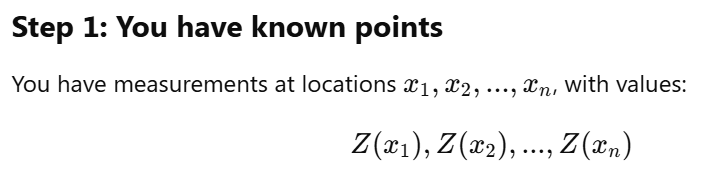
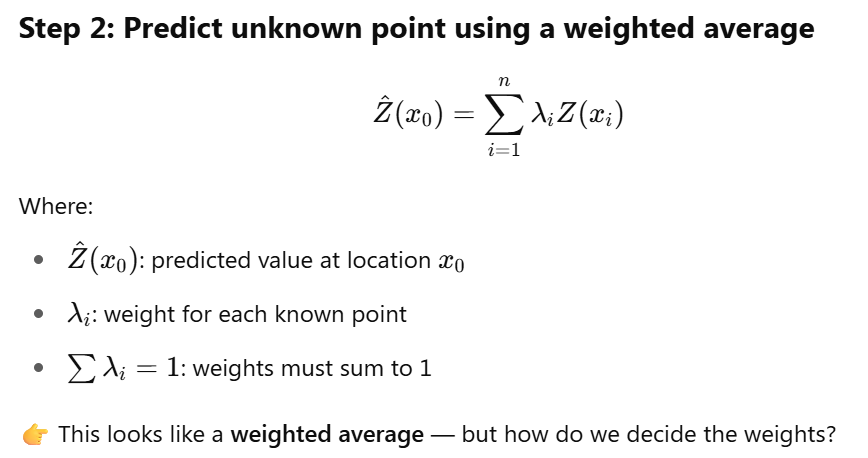
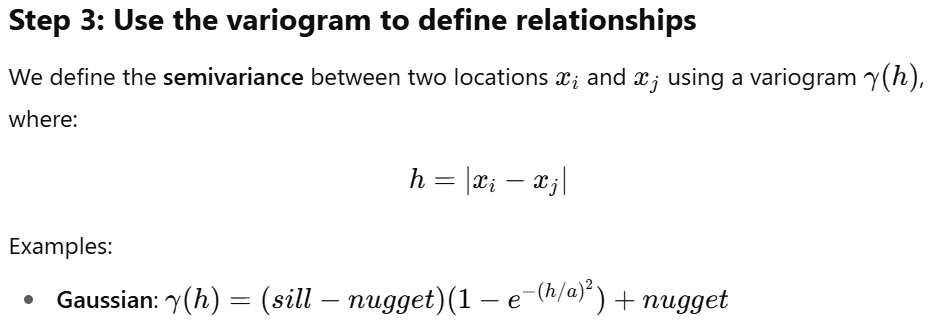
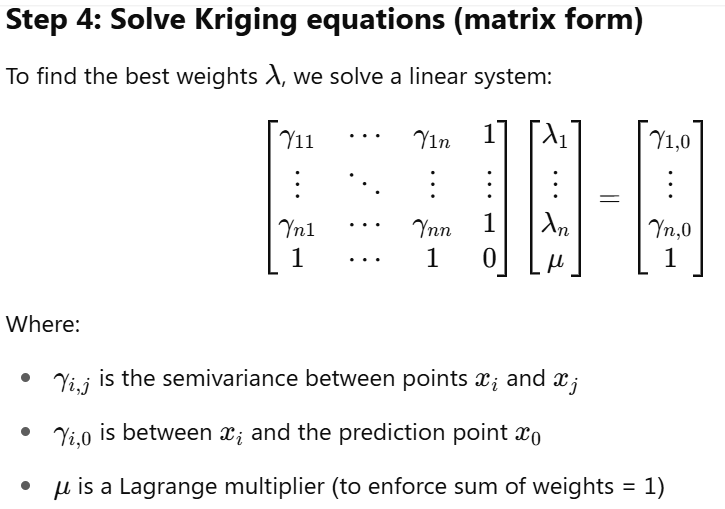
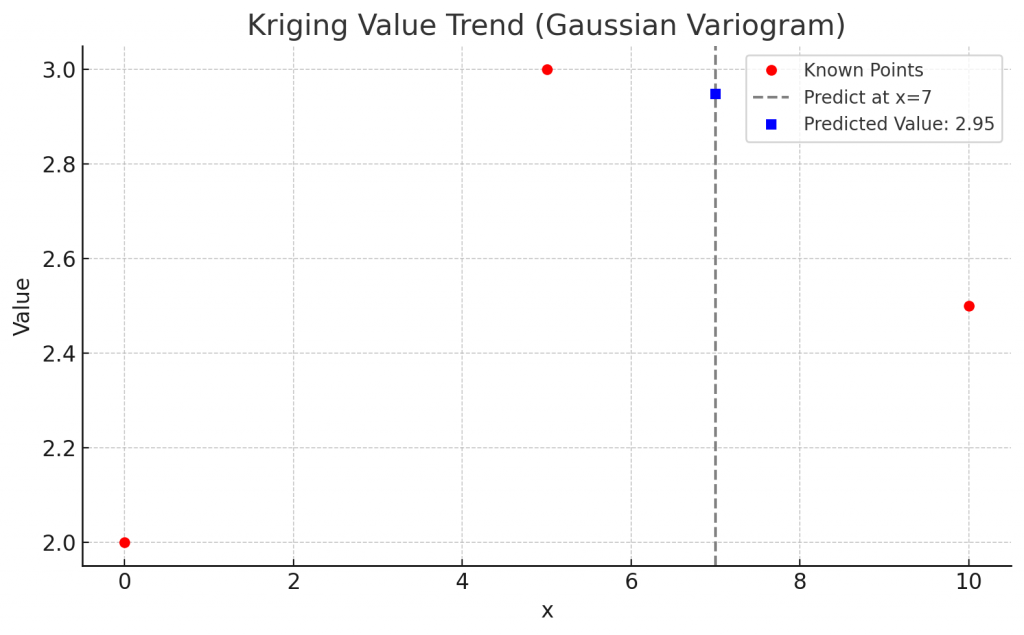
I’m working with this recently. It was use to interpolate the unmeasured data in environment. I asked chatgpt to explain the algorithm for me.

How are the weights chosen?
Kriging looks at
Distance: closer points are more relevant
Spatial correlation: how similar nearby points tend to be (modeled by a variogram)

The variogram describes how values “change” with distance. For example:
If points 1 meter apart are almost always similar → strong correlation
If points quickly become unrelated as you move away → weak correlation

from pykrige.ok import OrdinaryKriging
OK = OrdinaryKriging(
    x, y, values,
    variogram_model='gaussian',
    variogram_parameters=None,
    nlags=6,
    weight=True,
    enable_plotting=False,
    coordinates_type='euclidean'
)
z, ss = OK.execute('grid', gridx, gridy)
z[z < 0] = np.nan   # post-process results by masking negatives

variogram_model: controls how spatial correlation decays including linear, power, gaussian(default), spherical, exponential
variogram_parameters = {‘sill’: 0.8, ‘range’: 10, ‘nugget’: 0.1}
nlags: controls how many lag bins are used to calculate the experimental variogram. More bins is more smoother fitting, but slower.
If weight is True, It weight the variogram fitting by number of point pairs per lag.
coordinates_type
-euclidean: x, y in linear units (e.g., meters)
-geographic: lat/lon in degrees

Execute option: grid for mesh, points for specific locations

#If you want even more control (e.g., kernels, noise, trend), use GaussianProcessRegressor:

from sklearn.gaussian_process import GaussianProcessRegressor
from sklearn.gaussian_process.kernels import RBF, WhiteKernel, ConstantKernel

kernel = ConstantKernel() * RBF(length_scale=10.0) + WhiteKernel(noise_level=0.1)
gpr = GaussianProcessRegressor(kernel=kernel)

説明変数

説明変数คืออะไร เหมือนจะแปลออกแต่ก็งงๆ แล้วก็มันมีชื่อแถวๆนี้อยู่หลายตัว ตัวไหนเป็นตัวไหนไม่รู้ละ เลยมาเปิดเว็ปเช็คดู

ก็จะมี กลุ่มตัวแปร X ที่เป็น input

  • 説明変数:explanatory variable ตัวแปรอธิบาย
  • 予測変数:predictor variable ตัวแปรทำนาย
  • 独立変数:independent variable ตัวแปรอิสระ

แต่แอบงง 予測変数 ตัวแปรทำนาย แปลมาแล้วชื่อเหมือนจะเป็น output

予測変数とは、結果変数 (目的変数や応答変数とも呼ばれます) を予測するために使用する入力変数です。
ตัวแปรทำนายคือ ตัวแปรinputที่ใช้ทำนายผลลัพธ์…โอเคตามนั้น
มันใช้ในการทำนาย ไม่ใช่ผลลัพธ์จากการทำนาย

ส่วนอีกกลุ่มคือ ตัวแปร Y ที่เป็น output/result มีดังนี้

  • 目的変数:response variable ตัวแปรวัตถุประสงค์
  • 結果変数:outcome variable ตัวแปรผลลัพธ์
  • 従属変数:dependent variable ตัวแปรตาม
  • 応答変数:response variable ตัวแปรตอนสนอง

เรามักจะเจอ Y กับ X เป็นคู่ๆตามนี้ (ทำไมเค้าเอา Y นำ X นะ…)

「目的変数&説明変数」
「従属変数&独立変数」

reference:
https://yoshida931.hatenablog.com/entry/2018/05/13/232801
https://best-biostatistics.com/correlation_regression/variables.html